
Overview
Introducing OffTempo, a new no-configuration Burp Suite extension designed to assist pentesters as they perform timing-based attacks. In this post, Senior Security Engineer Riccardo Nannini walks through OffTempo's ability to report a statistically grounded measure of distinguishability and how other engineers can use this tool to better assess whether a suspected timing issue is real and worth a deeper investigation.
By Riccardo Nannini
On the art of eyeballing
It all started a few months ago while reviewing web APIs as part of a penetration test for one of our clients. The Kotlin code concerning authorization looked something like the following:
private fun getResource(input: getResourceInput, callerAccount: String): Resource {
	[...]

	// getResourceWithId is an existence check ony (i.e. no validation about caller accountId)
	// This will throw NotFoundException if the resource does not exist at all
	val resourceId = input.resourceIdentifier
	val foundResource = apiClient.getResourceWithId(resourceId)

	// validateAndAuthorizeOperation is an ownership check to ensure the caller owns the resource and is authorized for the operation. Throws NotFoundException if not
	apiClient.validateAndAuthorizeOperation(resourceId, callerAccount, "GetResource")

	[...]
}
This authorizer was shared by all APIs concerning a specific set of operations offered by our client. After attempting and failing to find any authorization-related vulnerabilities in the internal authorizer function validateAndAuthorizeOperation, I was left wondering if resource enumeration was feasible.
This set of APIs used a global, unique identifier to reference the main resource being handled by them. As the developers noted in the comments, the function returned 404 Not Found both for requests containing a non-existing resource and for requests whose caller attempted to access an existing resource it was not authorized to access. This behavior effectively rendered resource enumeration attacks based on response content differentials useless.
The very same comment, however, gave me an interesting insight. After checking for the existence of the requested resource, the getResourceWithId function throws an exception and makes the API return 404 right away. The inner authorizer is never invoked in such a case, which makes sense from a logical standpoint. After all, what is the point of checking authorization for a resource that does not exist? This exact behavior, on the other hand, enables time-based side channels that I ended up exploiting.
The idea is very simple: pick one of the APIs using this authorizer, invoke it passing the ID of a resource you know exists and measure the response time. Do the same with a resource you know does not exist and get the timing data. Now repeat a bunch of times to get a decent sample. If you are feeling fancy, you can even make a plot.
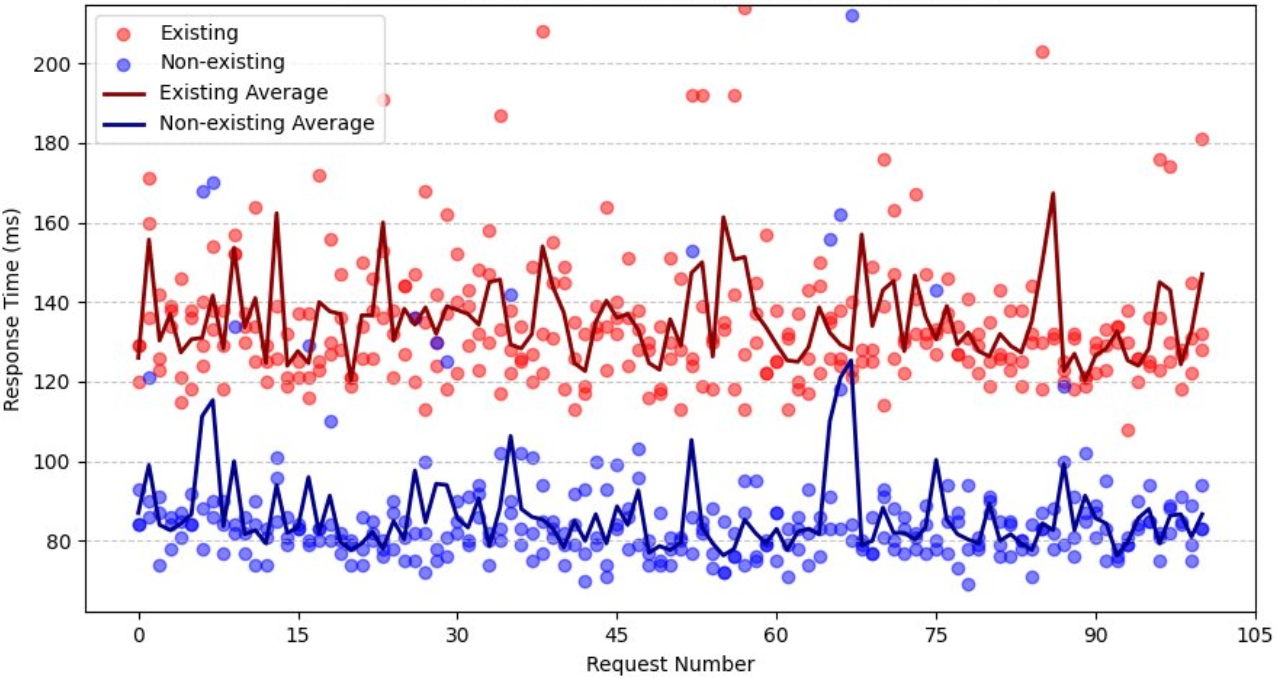
By returning an exception right away after checking for existence, the round-trip time was noticeably lower for non-existing resources than for existing ones that had to go through authorization checks too.
Looking back at this finding a few days later, however, I was left with an uncomfortable feeling. The timing data I gathered was clear-cut; it was very easy to "see" that response times for existing resources were consistently greater than for non-existing ones. Some may say you could eyeball it.
That was it; I had found the issue: As a security engineer, I felt like I was not living up to the "engineer" part of it. What would have happened if the timing discrepancy was indeed present but the differences were not big enough for me to just "see" it? Is there really no better way than just eyeballing it? I wanted a better, somewhat statistically sound way to detect timing-based differentials. Something slightly less based on vibes and more on math. Some may say I just needed an excuse to justify going to grad school. After spending some time on the web looking for some tool or methodology that could fit my need and not quite finding what I had in mind, I decided it was probably easier to just build it myself.
OffTempo
My goal was to build a drop-in, no-configuration tool whose main goal is to give a quick, statistically-based overview of the timing differences between two sets of requests. I wanted pentesters to have a quick and easy way to evaluate whether their hunch ("uh, this is weird") about a possible timing-based attack was hopeless or worth digging deeper.
I ended up building a BurpSuite extension capable of measuring timing data of HTTP requests originating from BurpSuite Intruder tabs and returning a statistical evaluation of the observed data.
For a quick demo, I deployed an API in a cloud provider to simulate a target. The API accepts one integer input parameter. If number is a multiple of 7, the web server waits for 10ms before responding with an otherwise indistinguishable 204 No Content response. This is a simple way to simulate a delay in the server response time between an existing resource and a non-existing one (although the extension can be used for any attacks relying on request timing such as timing-based blind SQL injection, password timing attacks, etc.).
        if event.get('queryStringParameters') and event['queryStringParameters'].get('number'):
            number = int(event['queryStringParameters']['number'])
        # If multiple of 7, wait 10ms
        if number is not None and number % 7 == 0:
            time.sleep(0.01)
        # Always return 204
        return {
            'statusCode': 204,
            'headers': {
                'Content-Type': 'application/json'
            }
        }
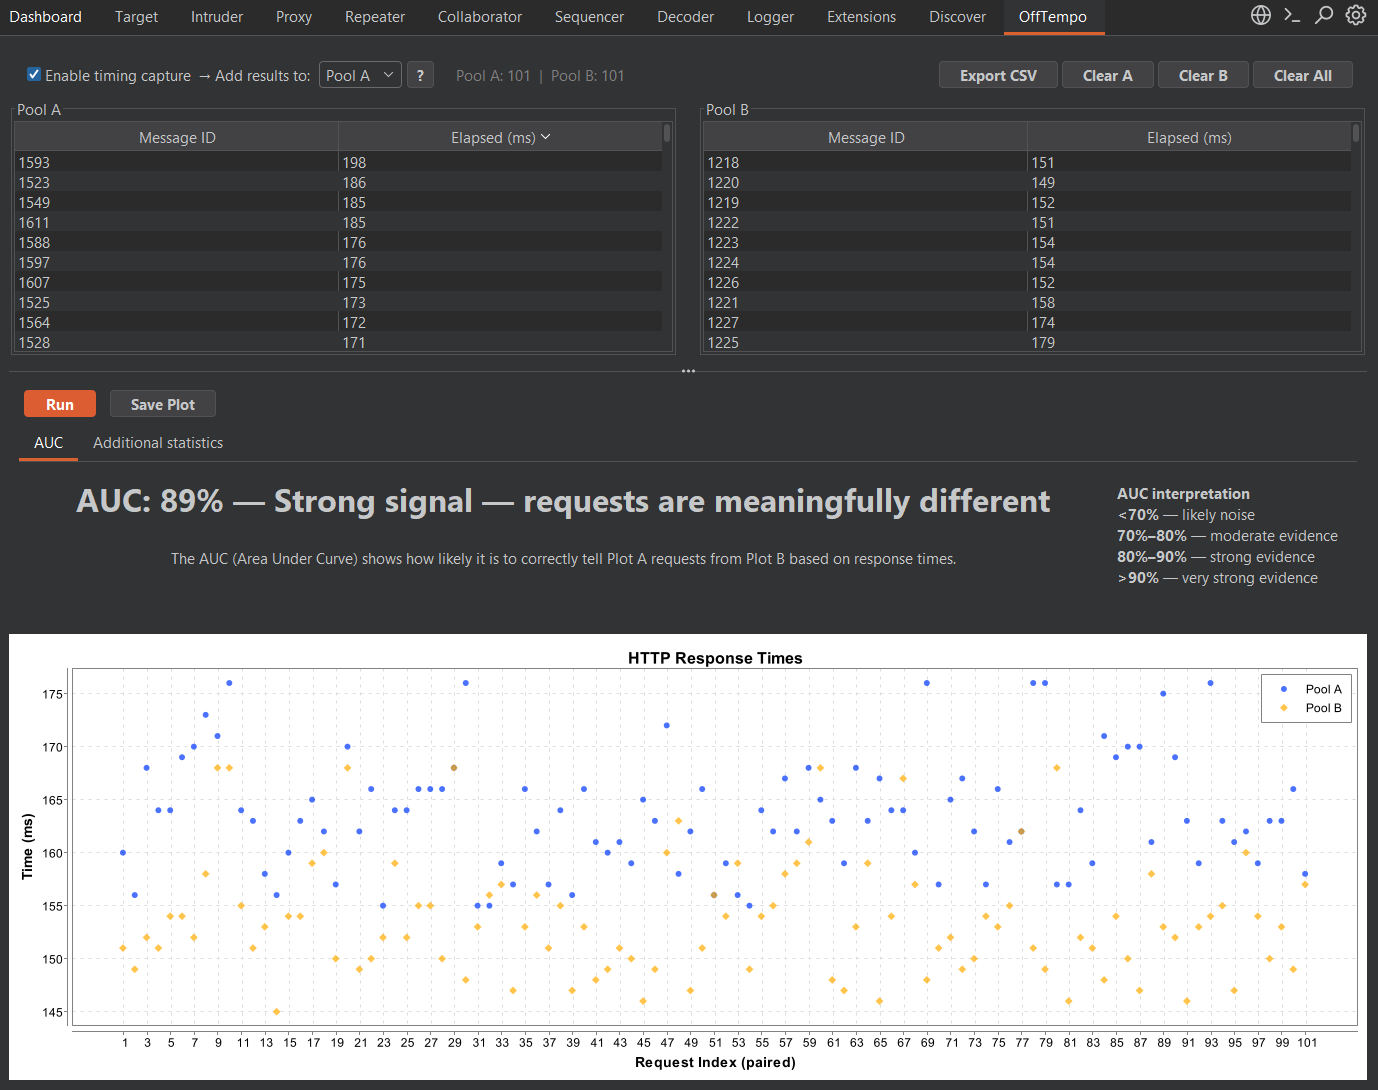
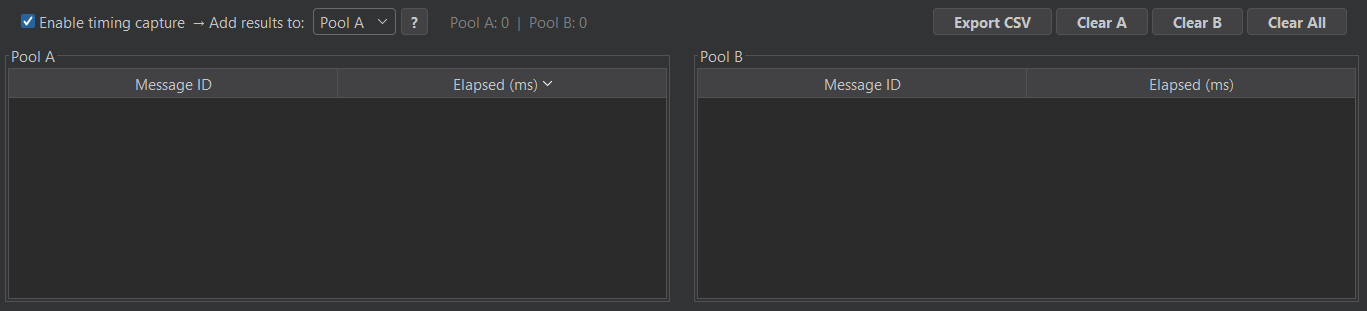
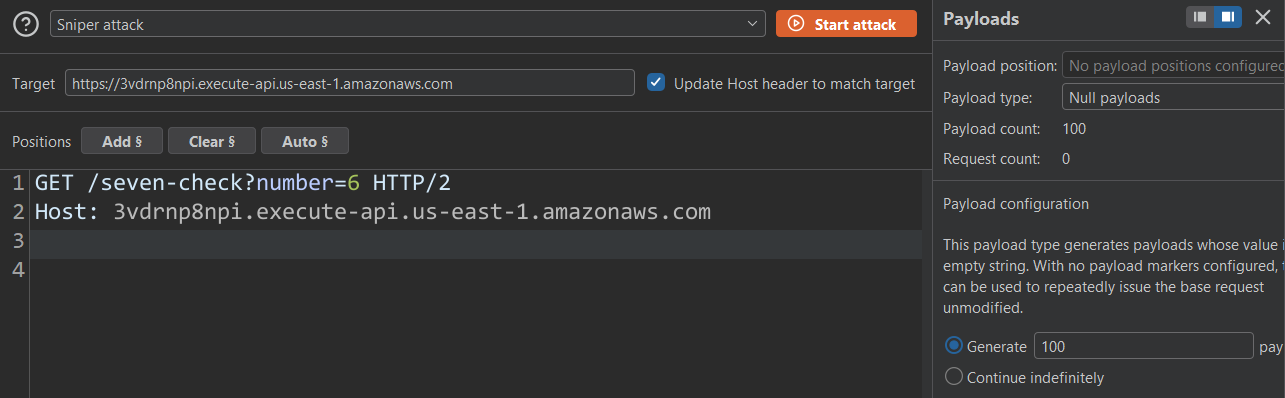
You start by enabling timing data capture in the extension and then setting up a Burp Suite Intruder tab.
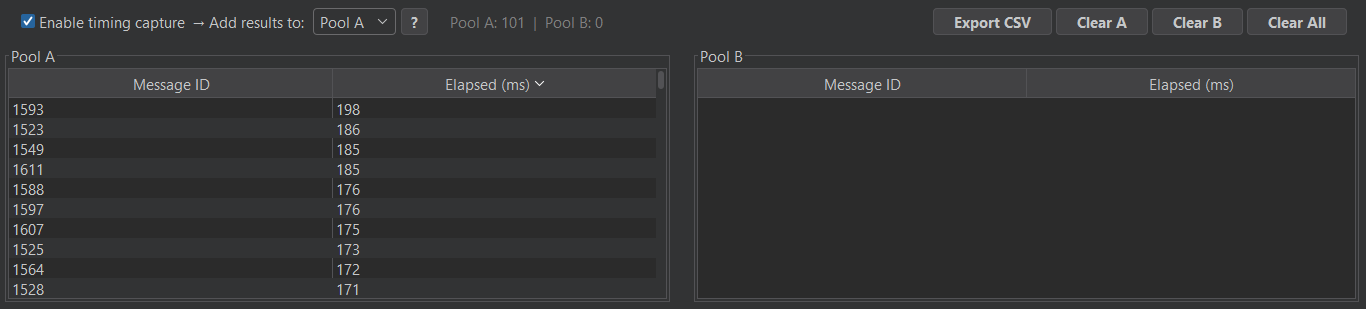
In this case I am going to send 100 identical requests with ?number=6 as my input.
This will populate the Pool A table in OffTempo.
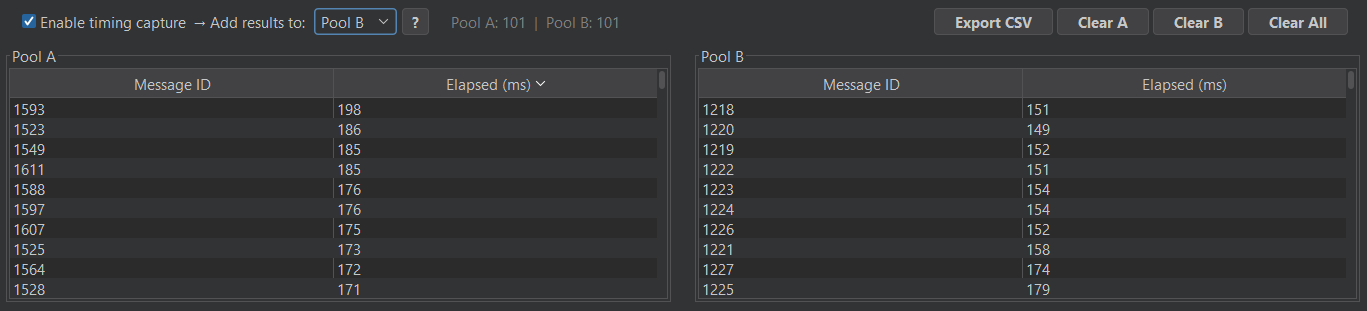
Repeating the process with ?number=7 and switching to Pool B gave me the timing data for my second request pool.
Clicking the Run button ran the statistical analysis and output a plot containing the timing data of the 100 requests in both pools.
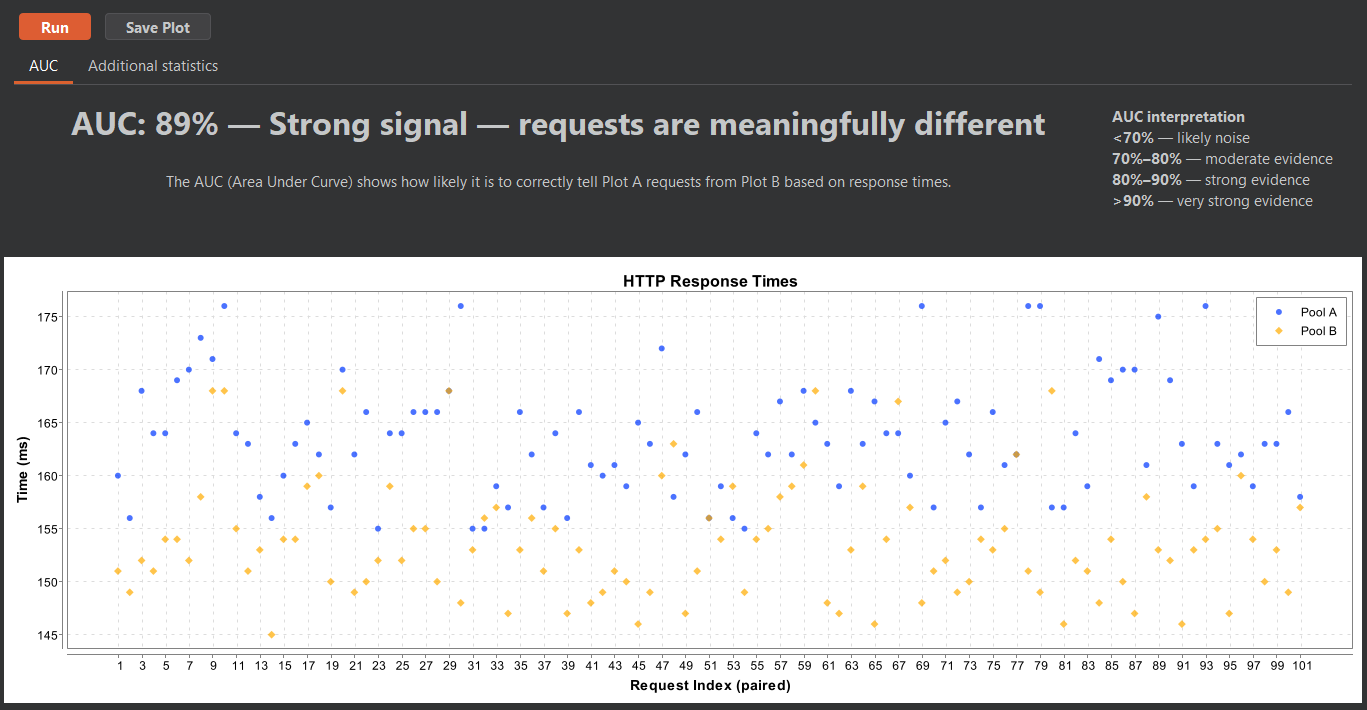
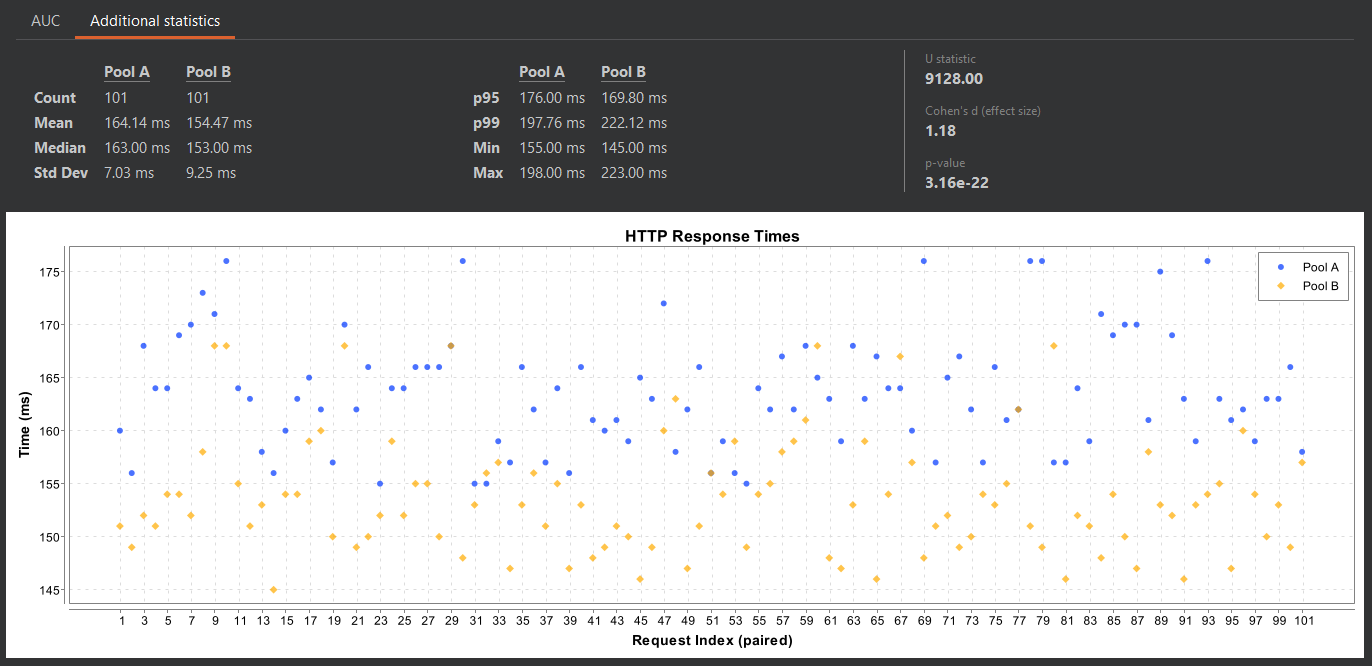
The main metric computed by OffTempo is the AUC (Area Under the Curve) via Mann–Whitney U. I will spare you the statistical derivation of this metric, which can be intuitively interpreted as "the probability that a randomly drawn observation from Pool A exceeds a randomly drawn observation from Pool B (or vice versa)." At a glance, the metric does a good job at giving an overview of how distinguishable the observations from the two pools of requests are. Bigger number, bigger evidence. Additional metrics are also computed to give a better overview of the statistical properties of the collected data for those interested in a deeper analysis.
The requests contained in each pool don't have to be identical. If you are looking for a possible resource enumeration issue, it makes sense to have OffTempo compare identical requests (to average out network delays, TCP window build-up, etc.) for a known existing resource against requests for a known non-existing one. If you are testing timing-based blind SQL injections, for example, one pool might contain a baseline query while the other is comprised of requests going through a list of payloads.
Related work
After concluding the development of the first version of OffTempo, I discovered the existence of a similar tool by F-Secure: Timeinator.
Timeinator is another BurpSuite extension with a similar goal. It recreates a sort of BurpSuite Intruder "sniper" mode within its extension tab, allowing you to paste payloads, add insertion points, and send multiple requests per payload. Timeinator then shows you a results table with minimum/maximum times, mean, median, and standard deviation.
There are a couple of main differences between the two tools. While OffTempo allows you to work with the full range of Intruder functionalities, Timeinator reimplements only Intruder "sniper" mode.
In terms of statistical analysis, Timeinator gives you some basic metrics like mean and median and leaves it to you to interpret the data, whereas OffTempo performs a deeper analysis through the AUC for ROC curves, giving users a quick overview without further work.